
When you’re choosing materials for a patio, path or driveway, the differences you can see are colour, texture and price. There’s another difference you can’t see: how much carbon it took to make the material and get it to your garden. We looked at the published data for the three options we specify most often in the Vancouver area. The gap between best and worst is bigger than most people expect.
Three materials, three very different footprints
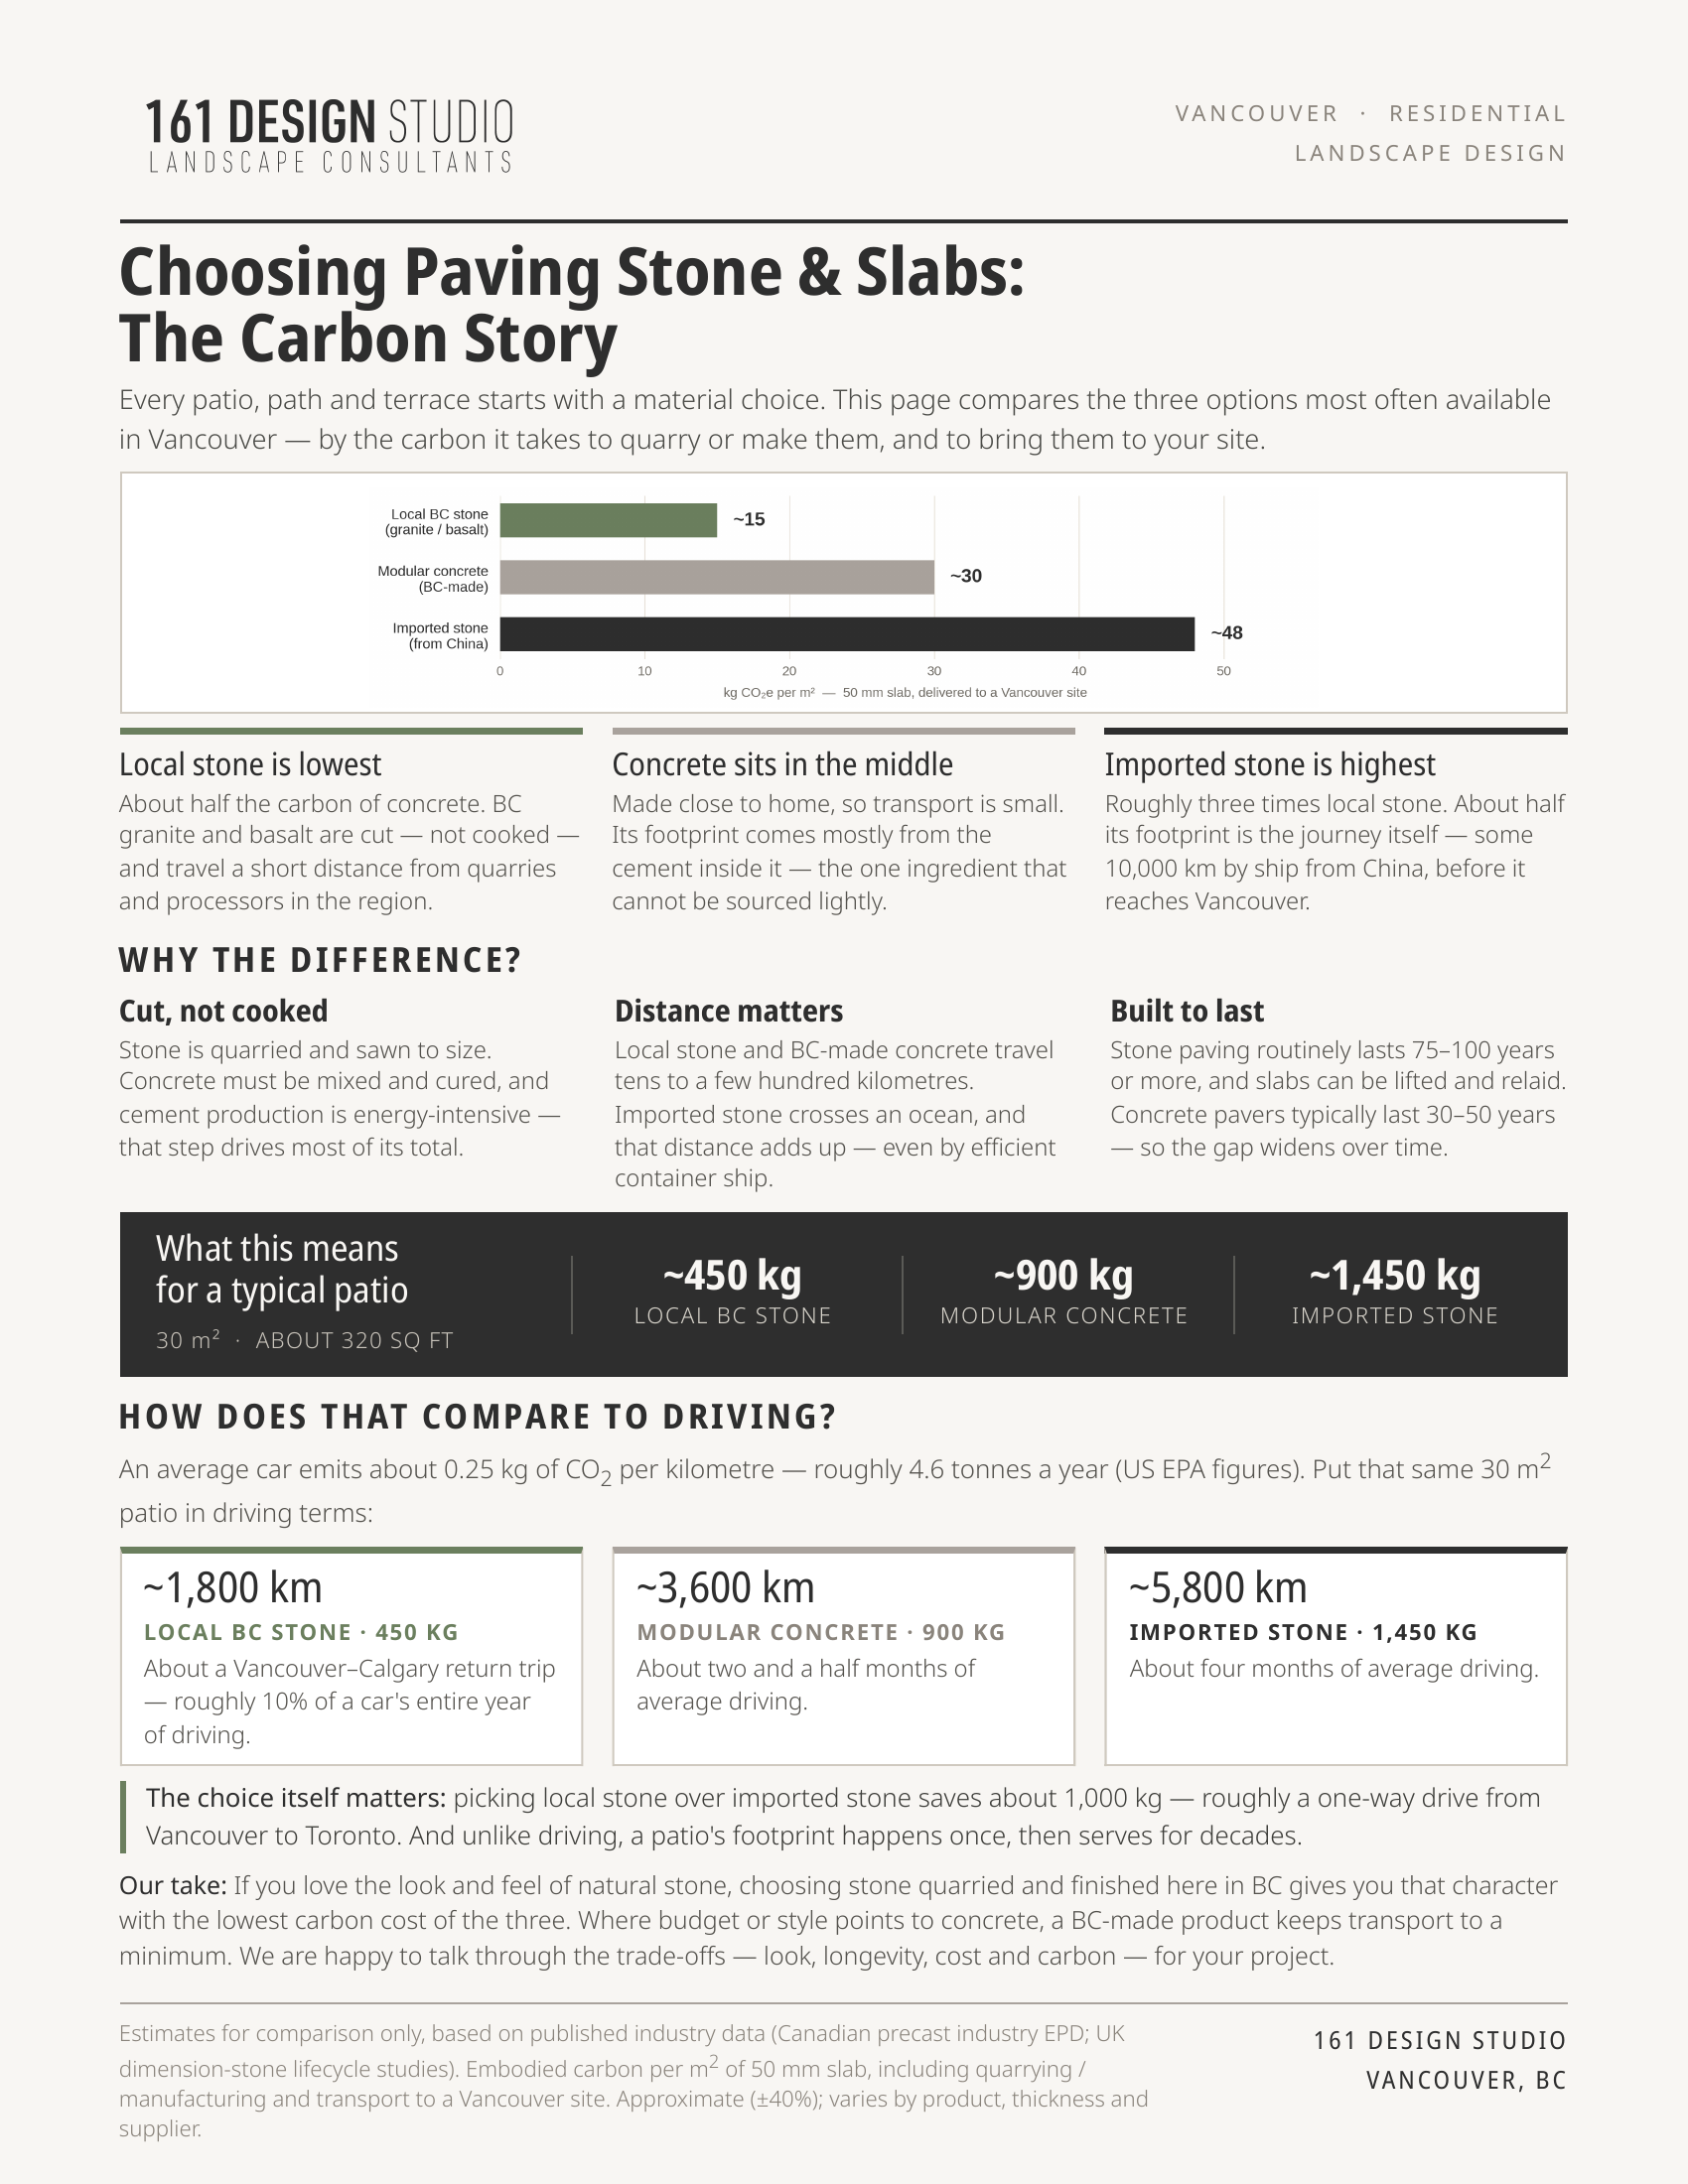
The figures below are embodied carbon — quarrying or manufacturing, plus all transport — for one square metre of paving slab, 50 mm thick, delivered to a Vancouver site:
- Local BC stone (granite or basalt): about 15 kg CO₂e per m²
- Modular concrete paving slabs, made in BC: about 30 kg CO₂e per m²
- Stone imported from China: about 48 kg CO₂e per m²
In other words, local stone comes in at roughly half the carbon of concrete, and imported stone at roughly three times local stone — for a product that looks much the same once it’s laid.
Why the difference?
Stone is cut, concrete is cooked. Natural stone is quarried, sawn and finished — energy-intensive, but there’s no chemical process behind it. Concrete pavers carry the footprint of cement, which is made by heating limestone to very high temperatures; the cement alone accounts for roughly two-thirds of a concrete paver’s footprint. And distance matters more than most people expect: stone shipped from China travels about 10,000 km by sea to reach Vancouver, and transport makes up about half of its total footprint. Local stone, by comparison, travels a few hundred kilometres by truck from quarries and finishing plants around Squamish, the Fraser Valley and Vancouver Island.
Putting it in perspective: the driving comparison
Kilograms of CO₂ are hard to picture, so here’s the same choice in driving terms. An average car emits about 0.25 kg of CO₂ per kilometre — roughly 4.6 tonnes a year. For a typical 30 m² patio:
- Local stone (about 450 kg total): ≈ 1,800 km of driving — a Vancouver–Calgary return trip, or about 10% of a car’s year
- Concrete (about 900 kg): ≈ 3,600 km — about two and a half months of average driving
- Imported stone (about 1,450 kg): ≈ 5,800 km — about four months of average driving
Choosing local stone over imported stone on that one patio saves about a tonne of CO₂ — roughly a one-way drive from Vancouver to Toronto. And unlike driving, which repeats every year, a patio’s footprint happens once. Spread over the decades it will be in the ground, even the concrete option works out to the equivalent of about 90 km of driving a year.
The lifespan factor
There’s a second half to the story: how long the material lasts. Natural stone slabs routinely serve 75 to 100 years or more, and they can be lifted and relaid — for levelling, for access to services below, or even in a new garden. Concrete pavers are durable too, but a typical service life is closer to 30 to 50 years. A material with twice the footprint that also lasts twice as long isn’t necessarily the worse choice — but in this comparison local stone wins on both counts.
What this means when you’re choosing
Carbon isn’t the only factor in a material choice — budget, appearance, availability and the design itself all matter, and there are projects where concrete pavers or a specific imported stone are the right call. But where a local stone works for the design, it’s one of the simplest wins available: lower footprint, longest life, and quarried and finished here in BC.
If you’re planning a patio, path or driveway and want to talk through material options, we’d be happy to walk through the trade-offs for your site.
A note on the numbers: these are estimates for comparison, built from published industry data — the Canadian precast concrete industry’s environmental product declaration, UK dimension-stone lifecycle studies, and standard transport emission factors. Individual products vary with thickness, supplier and finish, so treat the figures as approximate (within roughly ±40%). The ranking, however, is consistent across every study we found: local stone lowest, imported stone highest, concrete in between.